
The main objective of this project was to design an intuitive user interface (UI) and deliver a positive user experience (UX) for a personal finance management application. The focus was on giving users easy access to key financial insights while providing tools for planning and analyzing expenses in a simple, friendly, and approachable way.
To ensure clarity and alignment before starting the design, I outlined a set of key requirements. These served as guiding principles for both the UI and UX aspects of the project:
Responsiveness
Intuitiveness
Aesthetics
Functionality
The main objective of this project was to design an intuitive user interface (UI) and deliver a positive user experience (UX) for a personal finance management application. The focus was on giving users easy access to key financial insights while providing tools for planning and analyzing expenses in a simple, friendly, and approachable way.
Managing personal finances can often feel overwhelming: apps on the market tend to be overloaded with data, use overly technical language, or hide key features behind complex navigation. Many users abandon such tools because they feel cold, difficult, or unhelpful in everyday life.
The challenge was to design a dashboard that not only presents essential financial information clearly but also creates a friendly, supportive atmosphere. The solution needed to balance clarity (easy access to balance, expenses, and goals) with emotional engagement (tone of voice, approachable branding, and customizable interface).
The design process was structured to move from research and strategy to visual design and interaction details. Each step focused on understanding user needs and ensuring that the final solution would be both functional and emotionally engaging. Below is a breakdown of the key phases:

Before moving into wireframing and visual design, I conducted a competitive analysis directly in Figma. The goal was to better understand how existing financial tools structure their dashboards and how users interact with both desktop and mobile layouts.
Key Steps in Research
Insights & Takeaways
These insights shaped the foundation of Buddly’s design: a clear and customizable dashboard, approachable branding, and a structure that works well across both desktop and mobile use cases.

To ensure the dashboard would be intuitive and frictionless, I mapped out key user flows before moving into detailed design. This helped me identify the most common actions and make sure they could be completed in the fewest possible steps.

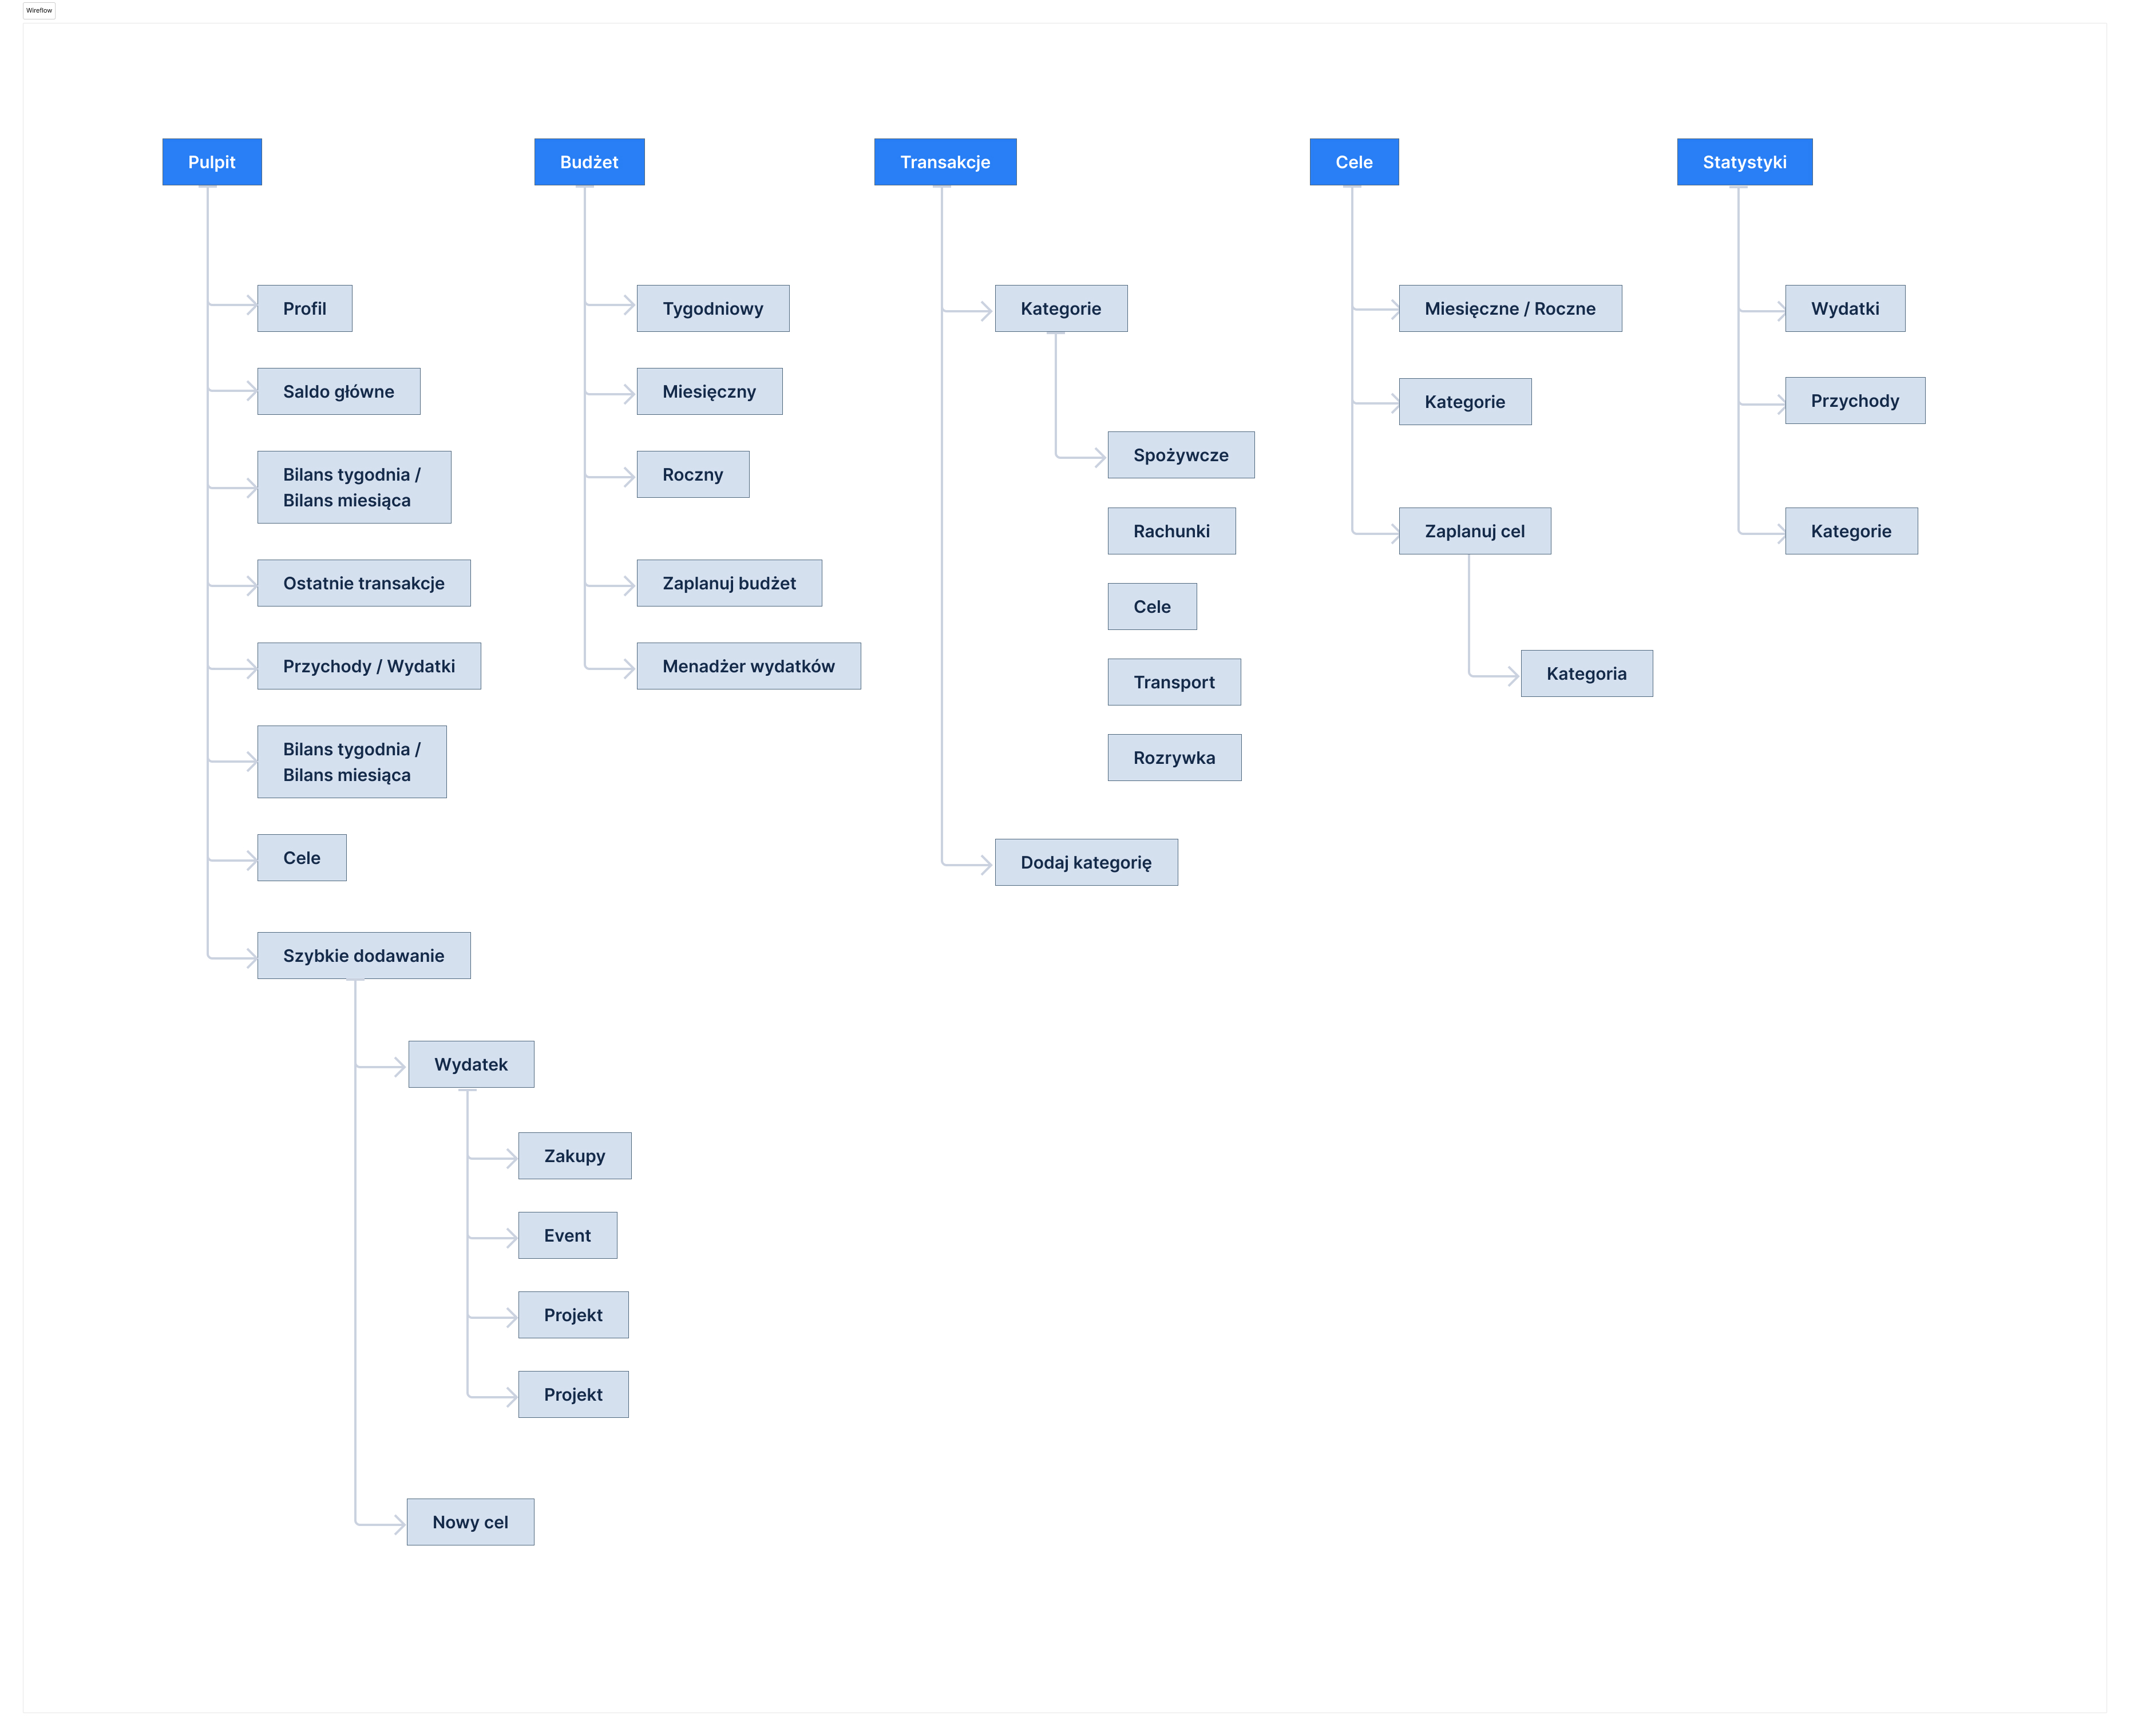
To define the overall structure and ensure smooth navigation, I created a site map outlining the main screens and their relationships. This helped me decide which information should be available at a glance on the dashboard and how users can move deeper into more detailed views.
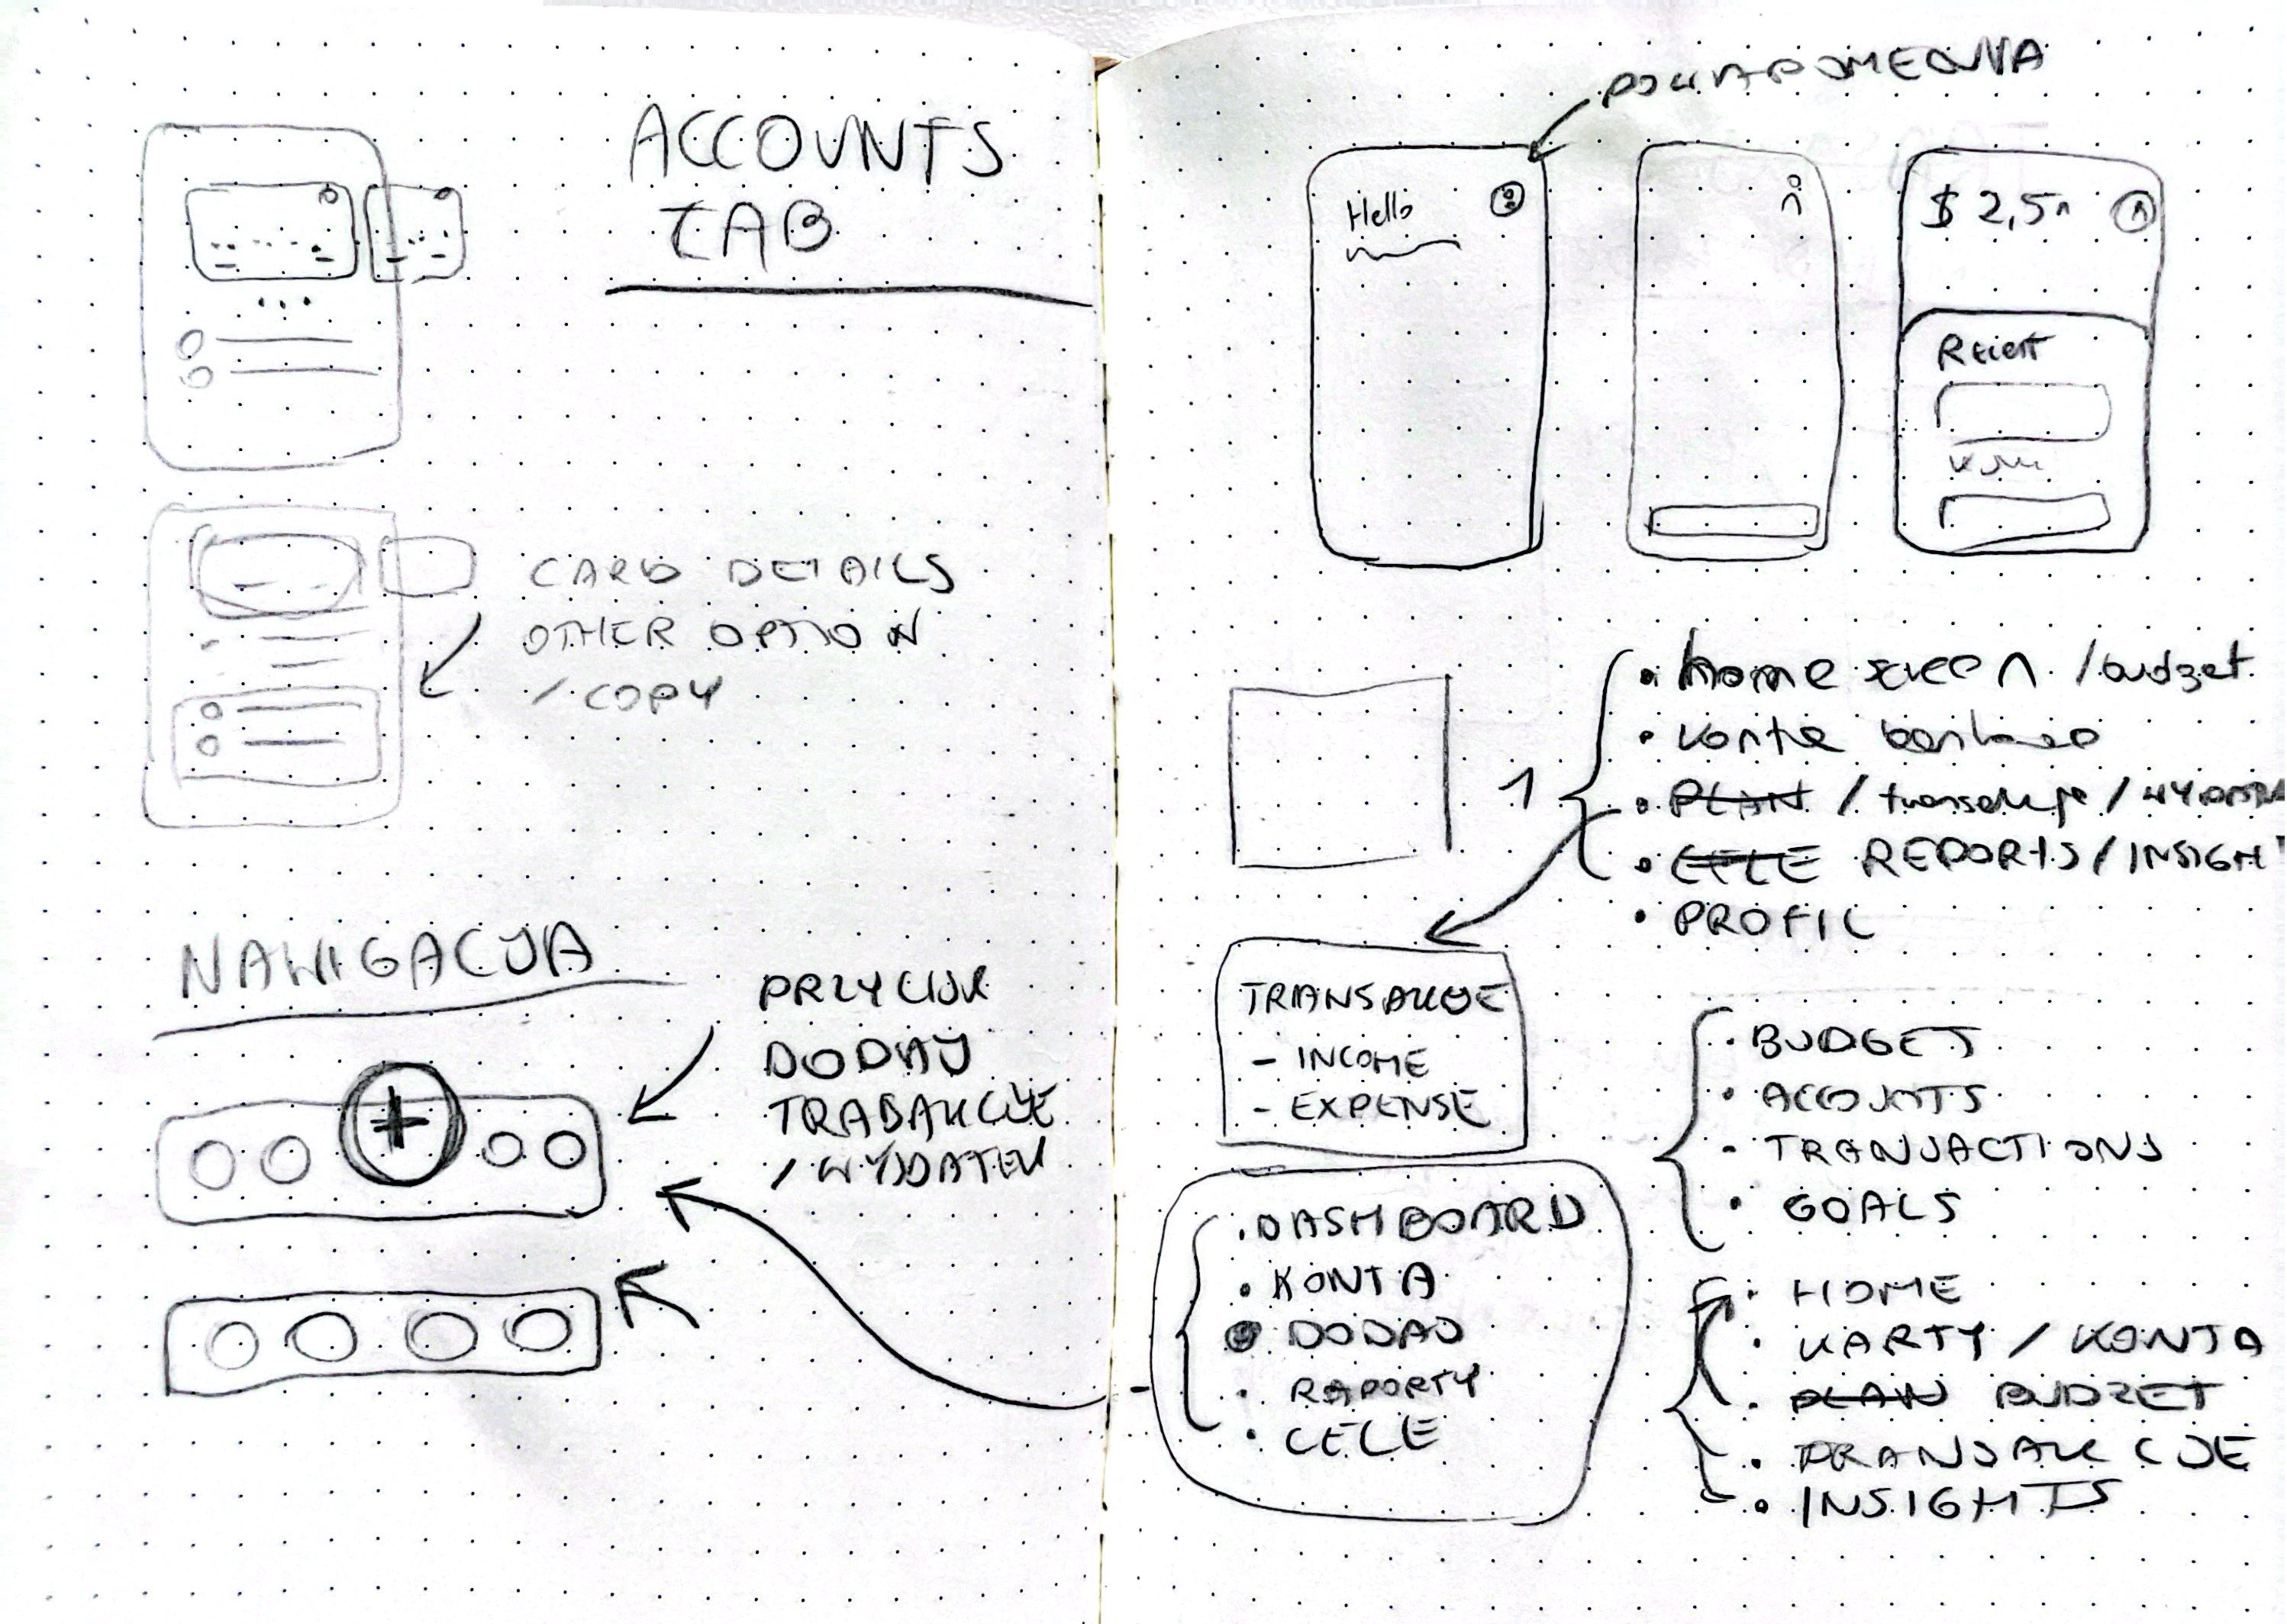
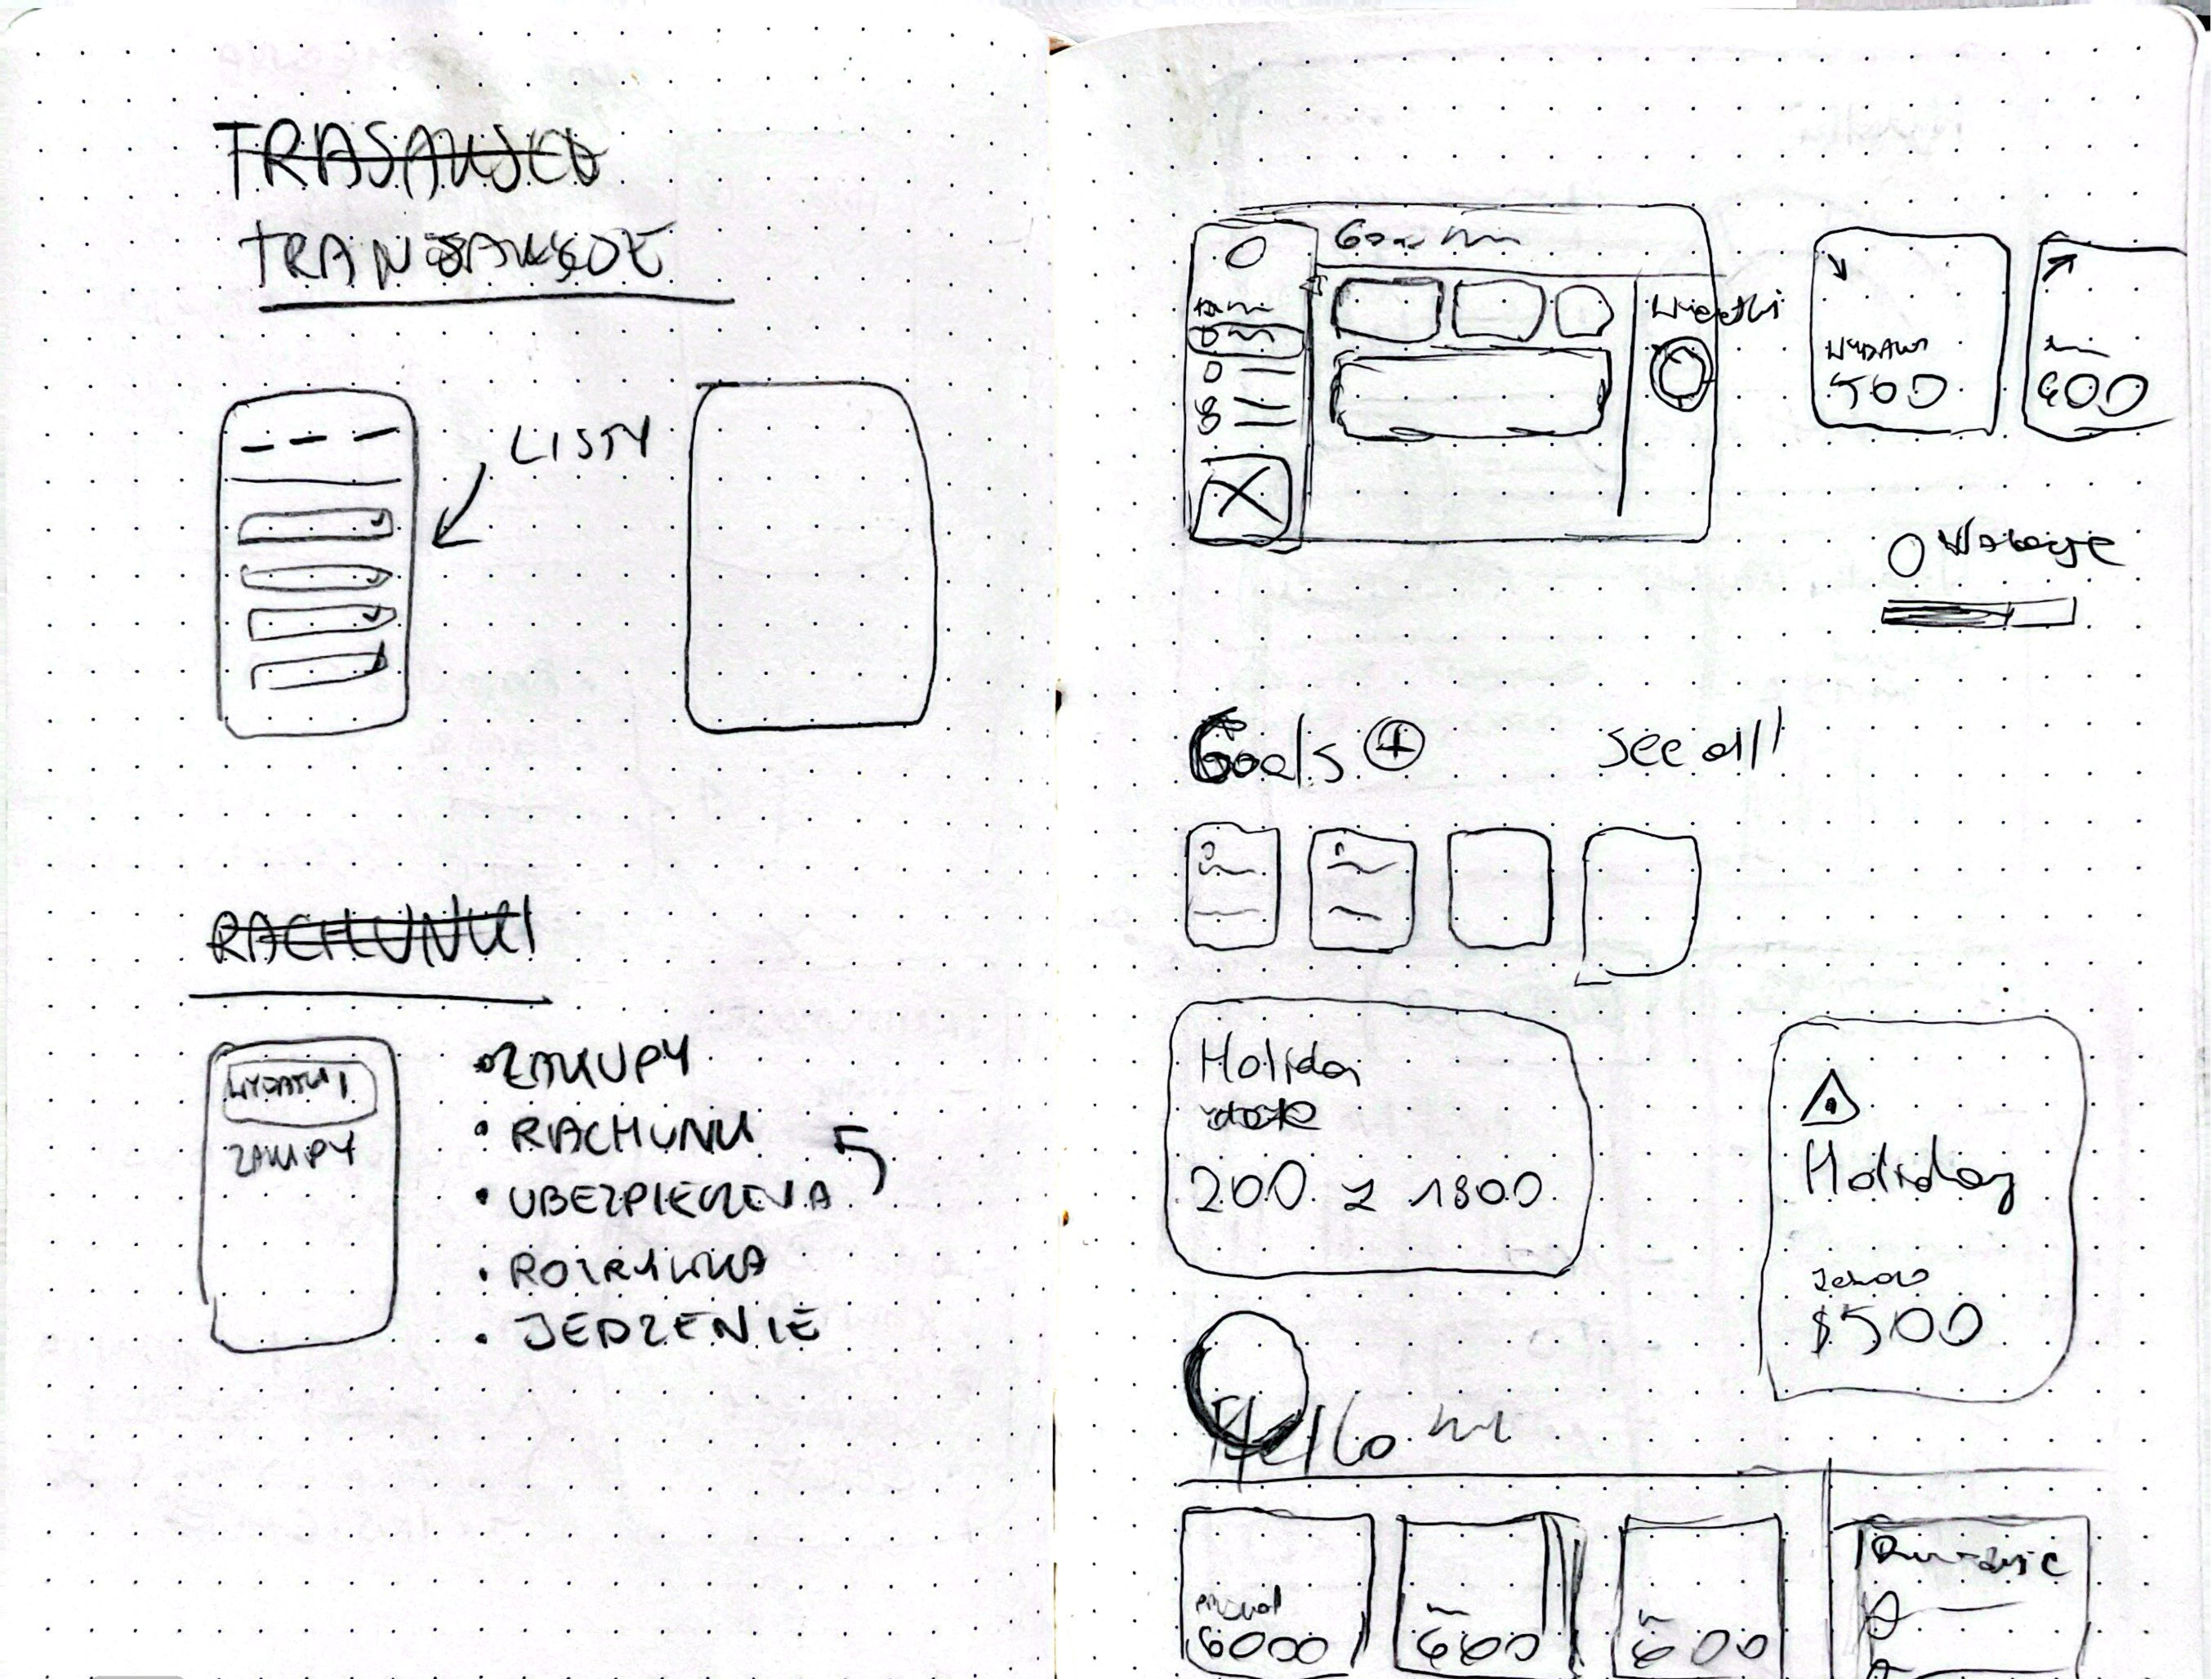
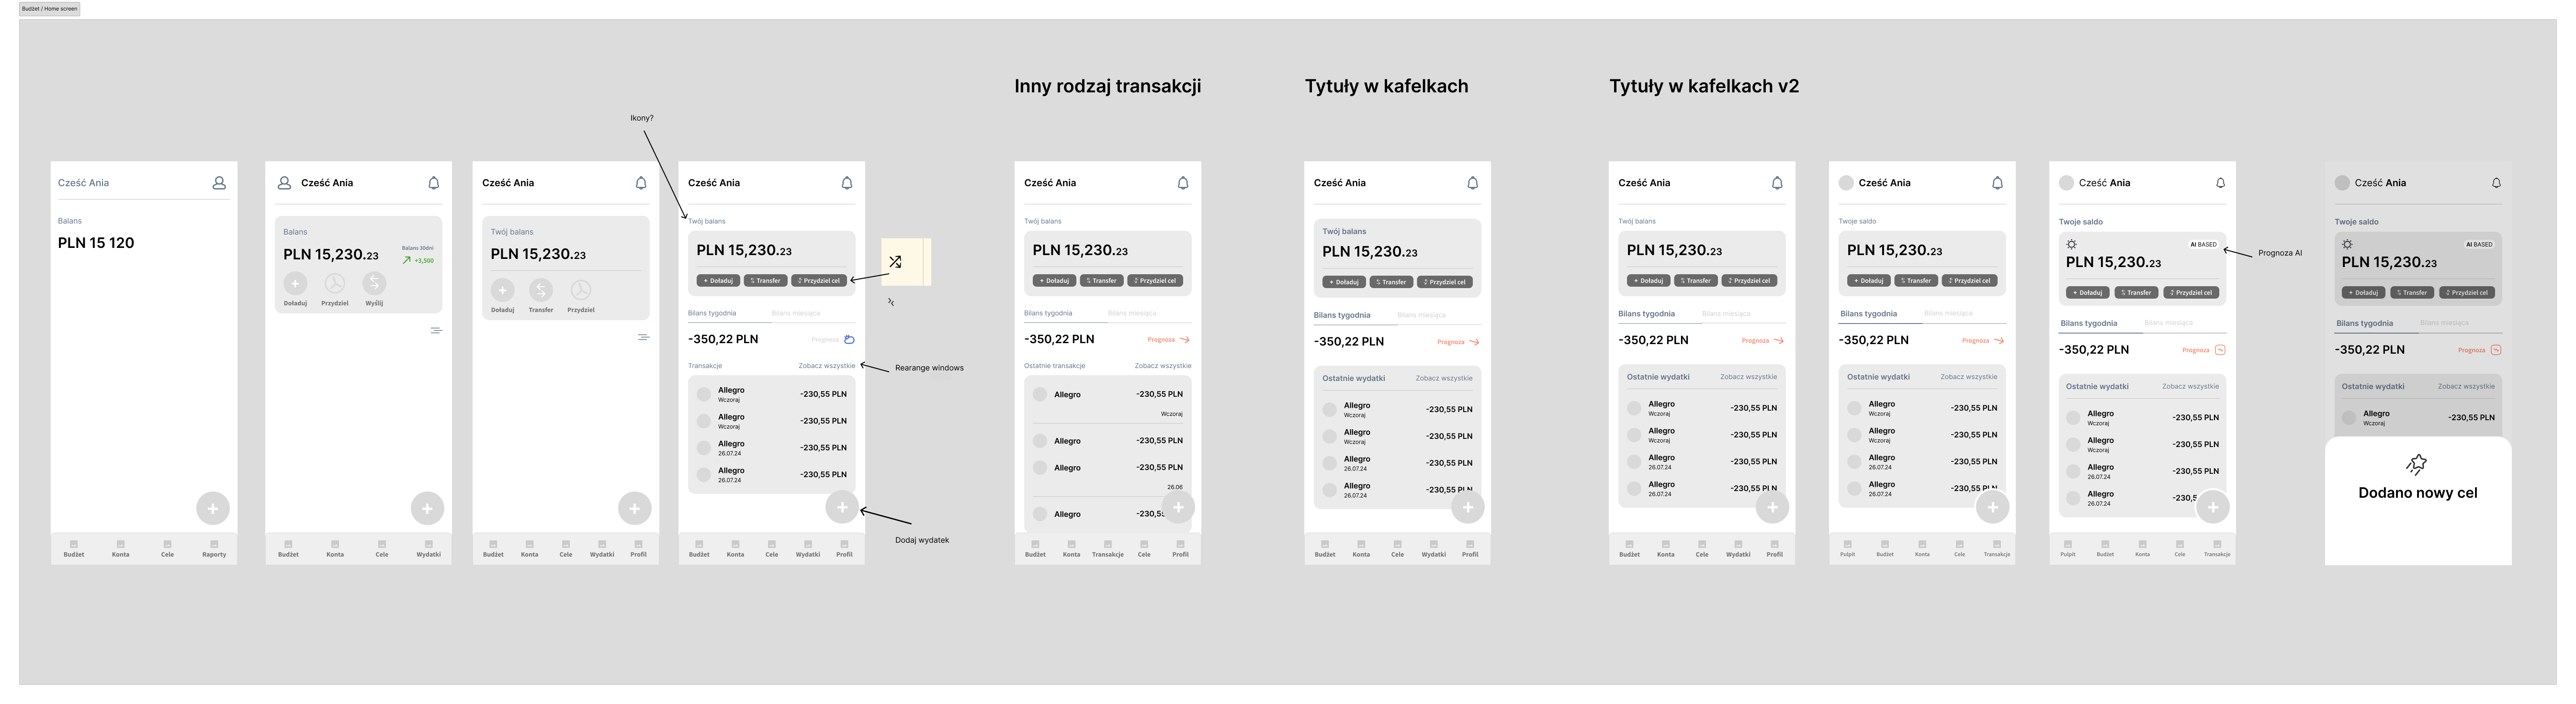
Before moving into high-fidelity design, I created wireframes to explore layout options and test the hierarchy of information. The goal was to validate the structure of the dashboard and ensure that the most important elements were visible at a glance.
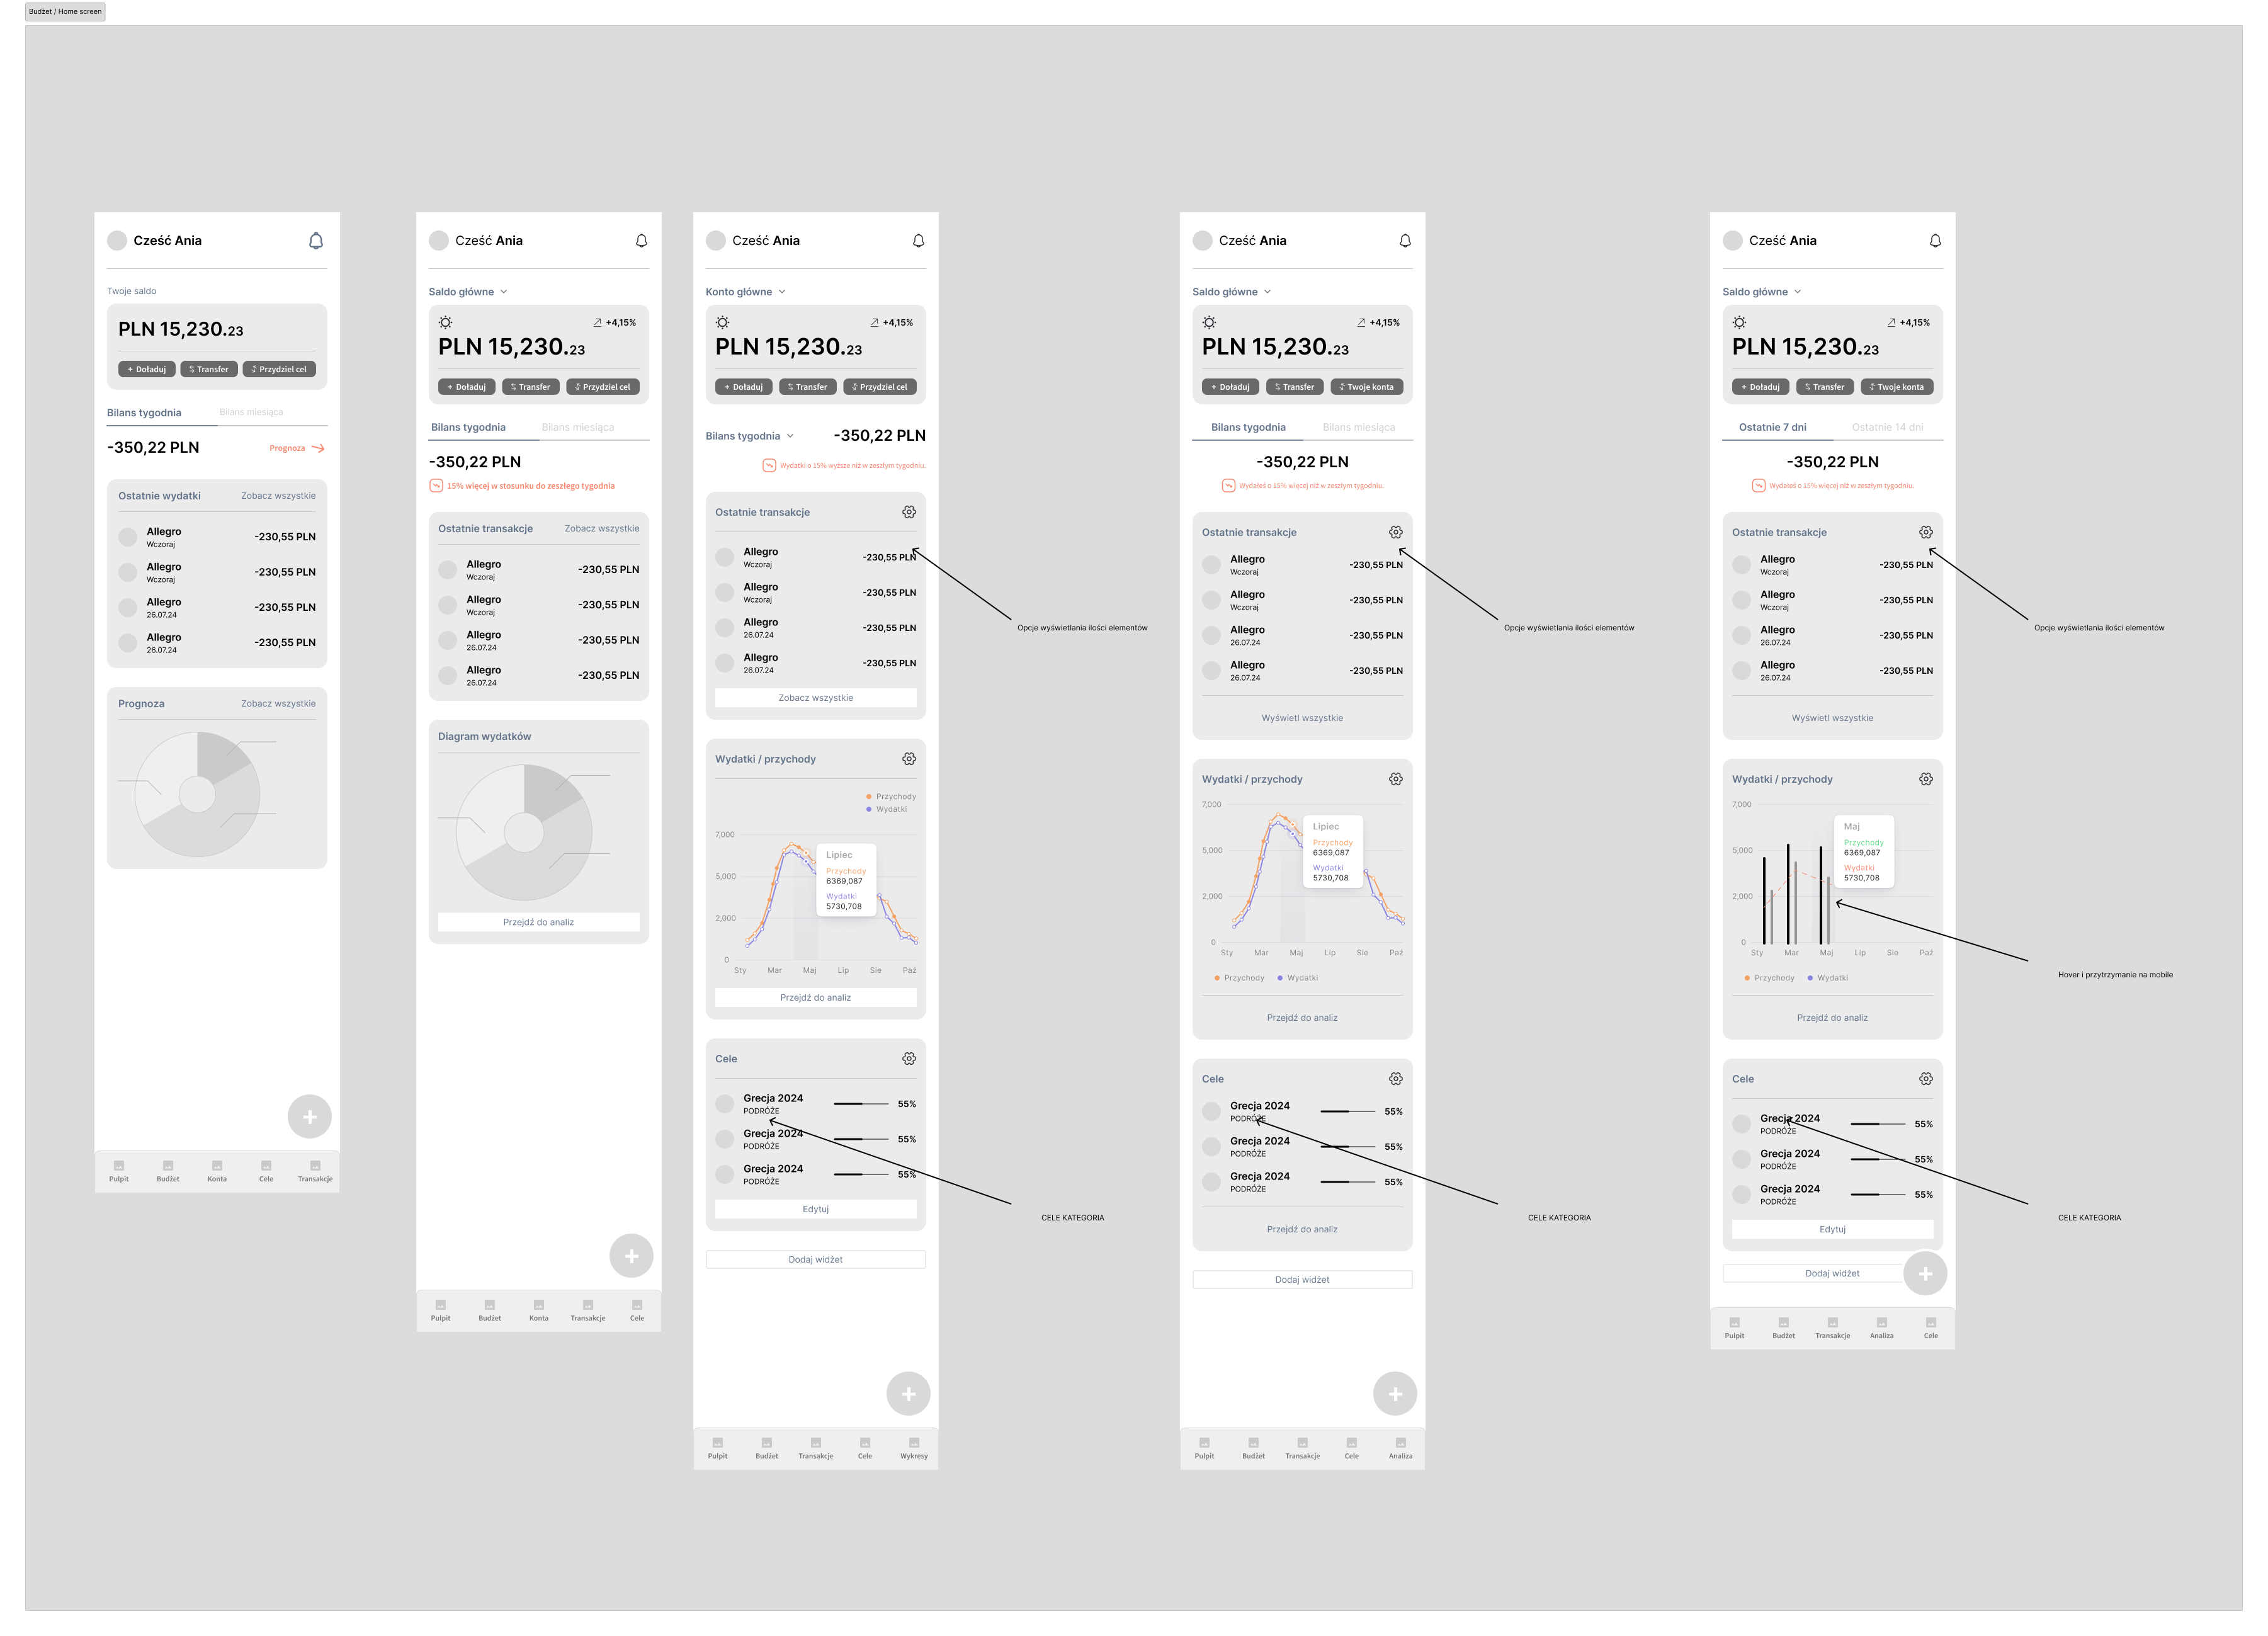

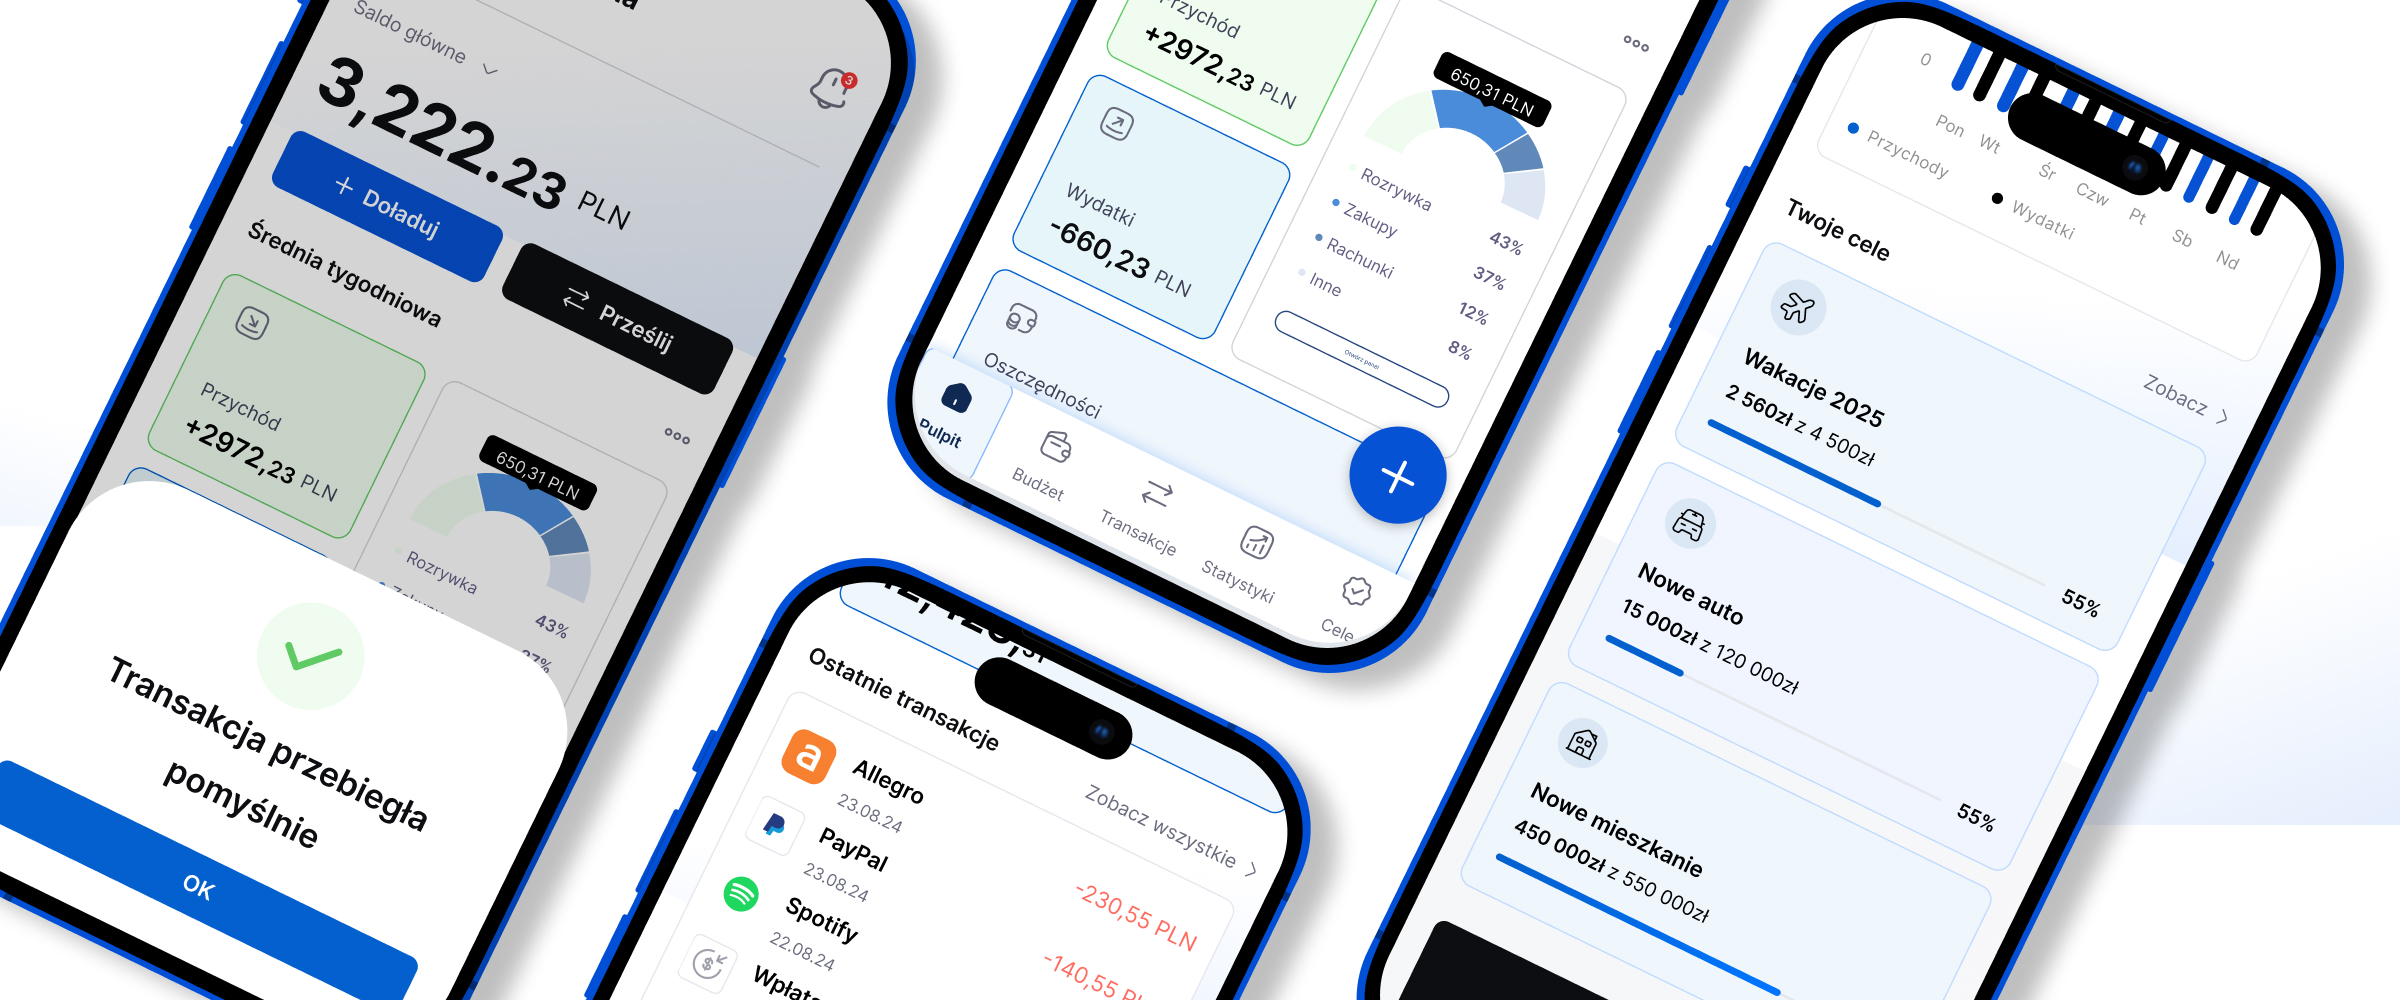
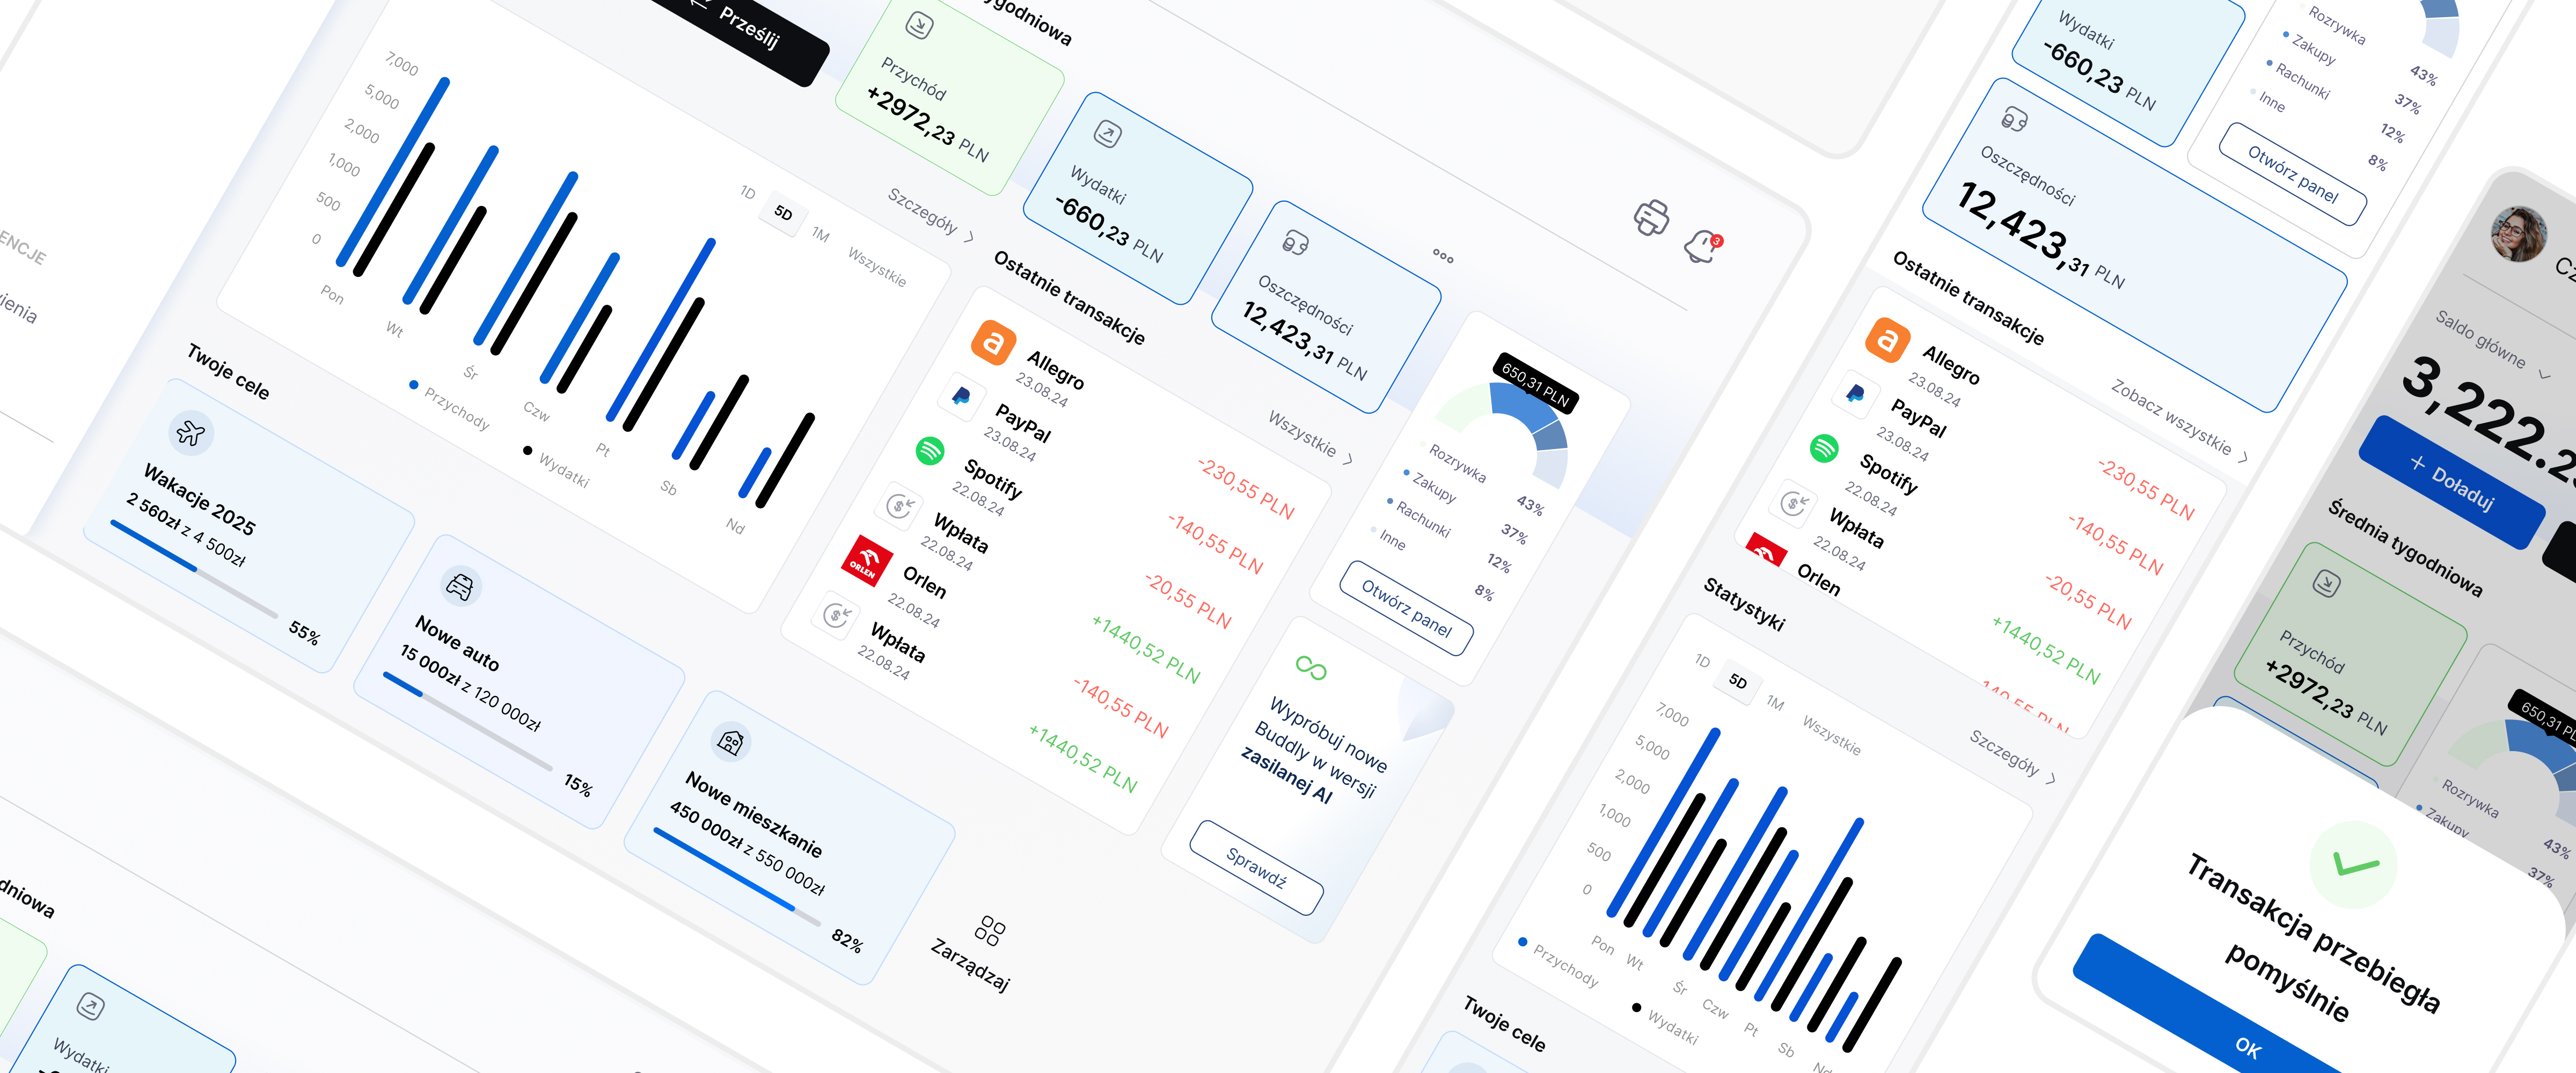
After iterations of research, wireframing, and user flow mapping, I developed the high-fidelity designs that reflect the final look and feel of the app. The focus was on creating a balance between clarity, usability, and personality – making finances feel approachable while keeping the interface professional and modern.


.jpg)
.svg)